Sunday, 20 September 2009

Brain Anatomy

Multimedia images


3D brain sections in full colour and multimedia.

Tuesday, 8 September 2009

Diastolic heart failure and pulmonary hypertension

Heart and lung involvement


Figure 1 – Severe left ventricular hypertrophy and grade 1 diastolic heart failure are revealed by echocardiography and Doppler ultrasonography. The apical 4-chamber view shows a thickened left ventricular wall and enlarged left atrium (A). Doppler evaluation shows impaired early diastolic relaxation (E wave) and vigorous atrial contraction (A wave) resulting in an E/A ratio of less than 0.75, which signifies early reduced left ventricular compliance (B). A normal E/A ratio is greater than 1.5, since most of the diastolic filling occurs early in a compliant left ventricle with the atrial component contributing a smaller volume at a lower velocity. (LV, left ventricle; LA, left atrium.)

Heart failure with normal ejection fraction (HFNEF) contributes to the largest number of cases of pulmonary hypertension (PH) in the elderly. Studies have shown that isolated HFNEF is present in 44% to 60% of patients with heart failure.20,21 In contrast to systolic dysfunction, HFNEF results from impaired myocardial relaxation resulting in decreased compliance and impairment of diastolic ventricular filling; the problem is not with ventricular contraction but rather with diastolic relaxation.
The most common causes of HFNEF are coronary artery disease, hypertension, aging, obesity, and aortic stenosis. The diagnosis is based on the presence of heart failure symptoms in the absence of depressed ejection fraction. An echocardiogram with Doppler studies can be useful in diagnosing diastolic dysfunction. The E/A ratio, in which E denotes the early peak mitral diastolic inflow velocity and A denotes the late diastolic peak mitral inflow velocity, can be useful.
Under normal conditions, E is greater than A and the E/A ratio is approximately 1.5. In early diastolic dysfunction, relaxation is impaired and there is vigorous atrial contraction, resulting in an E/A ratio of less than 0.75 (Figure 1). As the disease progresses, left ventricular (LV) compliance is reduced further, which increases early LV filling despite impaired relaxation, resulting in pseudonormalization of the E/A ratio to 1.5. In severe diastolic dysfunction, the E/A ratio is greater than 2 as a result of the LV filling occurring primarily in early diastole.22
Source: Pulmonary hypertension in the elderly, part 2: Treatment
http://jrd.consultantlive.com/display/article/1145425/1405017?pageNumber=6

Left ventricular hypertrophy and diastolic dysfunction

Kidney patients and their heart problems

Patients with chronic renal failure (CRF) on maintenance hemodialysis (HD) experience a series of metabolic and hemodynamic abnormalities that predispose to anatomic and functional change in myocardial performance1. Thus, left ventricular (LV) hypertrophy, a geometric change independently predictive of mortality2,3, is usually accompanied by diastolic dysfunction. Left ventricular systolic dysfunction seems to be less frequent4,5, although it also adds prognostic value6.

REFERENCES

1. Alpert MA. Cardiac performance and morphology in end-stage renal disease. Am J Med Sci. 2003; 325: 168-78. [ Links ]

2. Foley RN, Parfrey PS, Harnett JD, Kent GM, Murray DC, Barre PE. The prognostic importance of left ventricular geometry in uremic cardiomyopathy. J Am Soc Nephrol. 1995; 5: 2024-31. [ Links ]

3. London GM. Cardiovascular disease in chronic renal failure: pathophysiologic aspects. Semin Dial. 2003; 16: 85-94. [ Links ]

4. Sarnak MJ. Cardiovascular complications in chronic kidney disease. Am J Kidney Dis. 2003; 41: 11-7. [ Links ]

5. London GM. Left ventricular alterations and end-stage renal disease. Nephrol Dial Transplant. 2002; 17 Suppl 1: 29-36. [ Links ]

6. Sarnak MJ, Levey AS, Schoolwerth AC, et al. Kidney disease as a risk factor for development of cardiovascular disease: a statement from the American Heart Association Councils on Kidney in Cardiovascular Disease, High Blood Pressure Research, Clinical Cardiology, and Epidemiology and Prevention. Circulation 2003; 108: 2154-69. [ Links ]

Grade 2 diastolic dysfunction

What is "grade 2 diastolic dysfunction"? Serious or not?

There are four basic Echocardiographic patterns of diastolic heart failure, graded I to IV.

Grade I diastolic dysfunction is the mildest form and is called an abnormal relaxation pattern. On the mitral inflow Doppler echocardiogram, there is reversal of the normal E/A ratio. This pattern may develop normally with age in some patients and many grade I patients will not have any clinical signs or symptoms of heart failure.

Grade II diastolic dysfunction is called pseudonormal filling dynamics. This is considered moderate diastolic dysfunction and is associated with elevated left atrial filling pressures. These patients more commonly have symptoms of heart failure and many have left atrial enlargement due to the elevated pressures in the left heart.

Grade III and IV diastolic dysfunction are called restrictive filling dynamics. These are both severe forms of diastolic dysfunction and patients tend to have advanced heart failure symptoms.

Class III diastolic dysfunction patients will demonstrate reversal of their diastolic abnormalities on echocardiogram when they perform the Valsalva maneuver and are called reversible restrictive diastolic dysfunction.

Class IV diastolic dysfunction patients will not demonstrate reversibility of their echocardiogram abnormalities and are therefore called fixed restrictive diastolic dysfunction. The presence of either class III and IV diastolic dysfunction is associated with a significantly worse prognosis. These patients will have left atrial enlargement and many will have a reduced left ventricular ejection fraction indicating a combination of systolic and diastolic dysfunction. - Wikipedia


http://www.mhprofessional.com/downloads/academic/0071746269/Ch016_001-005.pdf


External links
http://fighttexastickets.com/picsntqh/diastolic-dysfunction-echocardiography
http://www.medscape.com/viewarticle/504948_6
http://www.docstoc.com/docs/100781766/Diastolic-Dysfunction-EchoCardiography-is-the-key
http://korhelypub.hu/admin/diastolic-dysfunction
http://trialx.com/curebyte/2011/07/07/heart-failure-diastolic-photos-and-a-listing-of-clinical-trials/
http://epdatabank.cardiostim.com/search_slide/results/taxonomy%3A23?page=2
http://www.news-medical.net/health/Diastolic-Dysfunction-Diagnosis.aspx
http://www.medhelp.org/posts/Heart-Disease/What-is-diastolic-dysfunction-grade-2/show/1670285
http://www.uptodate.com/contents/treatment-and-prognosis-of-diastolic-heart-failure
http://www.mhprofessional.com/downloads/academic/0071746269/Ch016_001-005.pdf

Friday, 21 August 2009

Energy Metabolism in Muscle


SGD 24-25 August 2009, Year 1 Medicine, Musculoskeletal Block
SGD 23-24 October 2013, Year 1 Medicine, Musculoskeletal Block


Topics covered:
  1. Energy sources for muscle contraction
  2. Aerobic and anaerobic pathways for energy production in muscle cells
  3. # of ATP produced in glucose catabolism
  4. Reactions of glycolysis that use or produce energy (2 ATP-utilizing reactions & 3 energy-producing reactions - 2 NADH, 2 ATP, 2 ATP)
  5. Severe muscular exercise and plasma lactate level increase
  6. Cori cycle and its importance in muscle metabolism
  7. Glucose-alanine cycle and its importance in muscle metabolism
  8. Reactions of beta-oxidation that use or produce energy (1 ATP-utilising reaction & 2 energy-producing reactions - 1 FADH2, 1 NADH)
  9. Products of 1 cycle of beta-oxidation
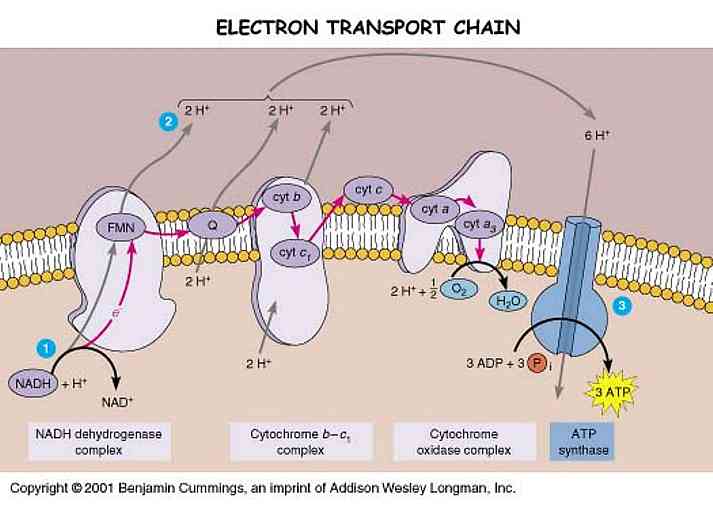
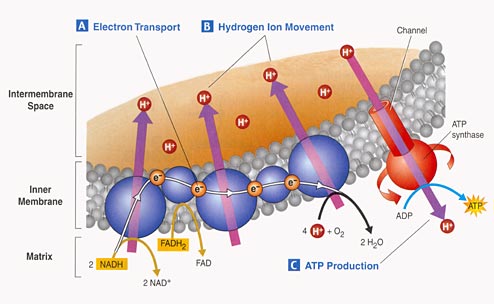
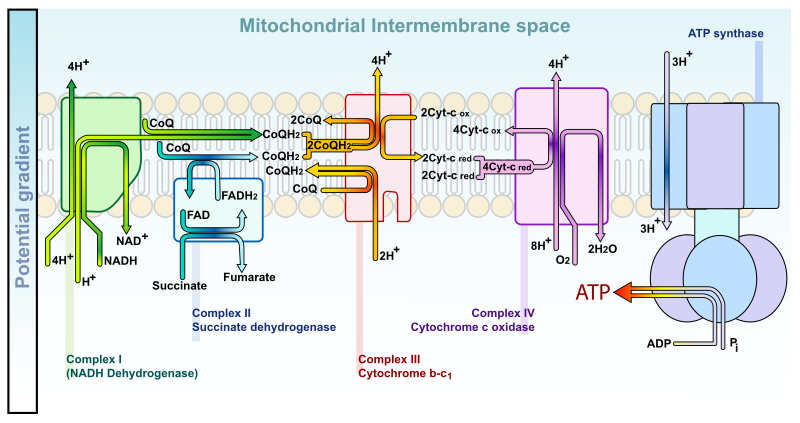
  10. # of ATP produced by oxidation of each NADH and FADH2 in ETC
  11. Calculation of net ATP produced from oxidation of 1 palmitic acid (C16:0)
  12. Citric acid cycle (Krebs cycle or TCA cycle) - where it occurs and # of energy-producing substances formed (mitochondrial matrix; 3 NADH, 1 FADH2, 1 GTP)
  13. Why TCA cycle is an amphibolic pathway (catabolic - oxidation of acetyl CoA, anabolic - TCA intermediates used for biochemical anabolic pathways)
  14. Why TCA cycle is an aerobic pathway
  15. Chemiosmotic theory of oxidative phosphorylation
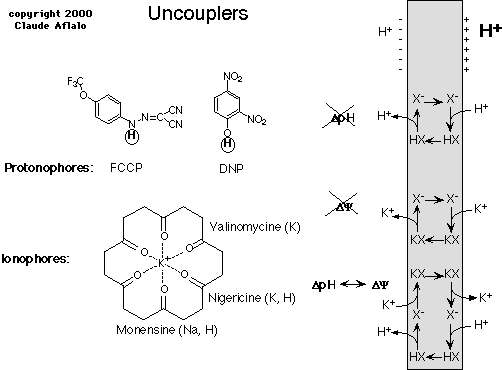
  16. Inhibitors and uncouplers of ETC
  17. Why impairment of ETC causes lactic acidosis
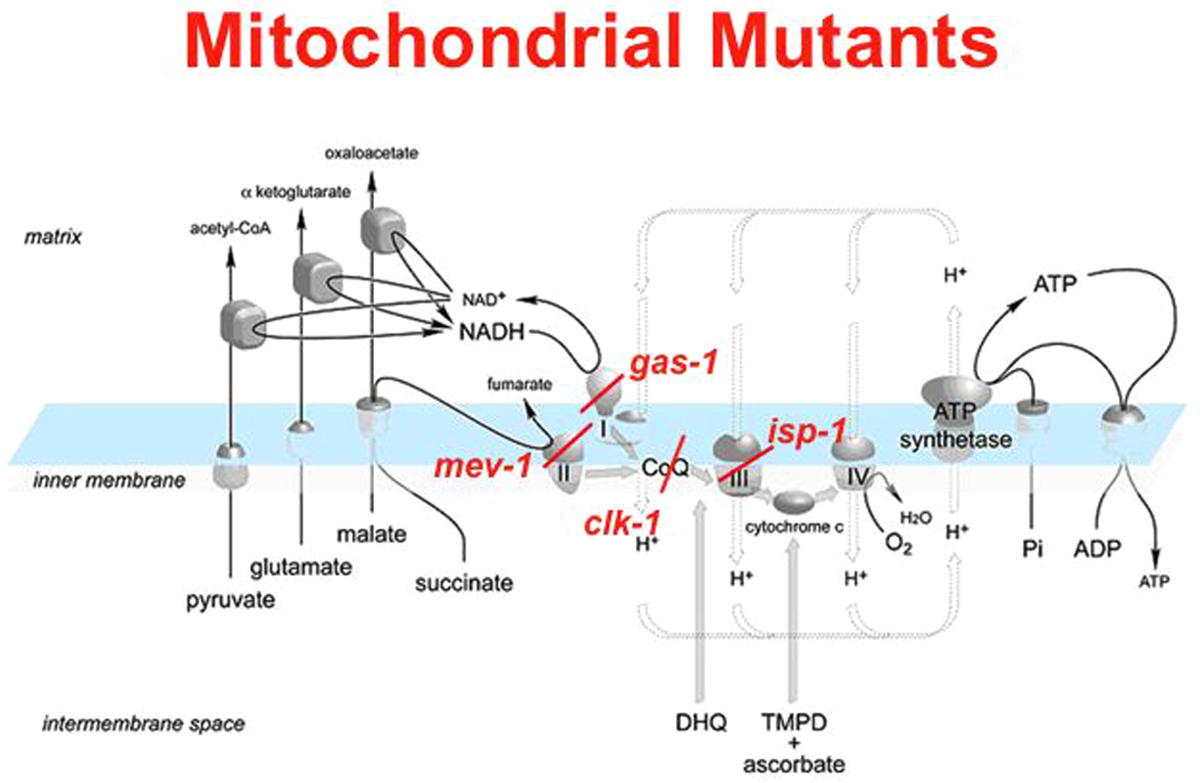
Inhibitors of ETC and DNA mutations lead to reduced activity of ETC

When the respiratory chain is blocked, pyruvate accumulates outside the mitochondria, and when too much pyruvate has accumulated, the cells start to convert it to lactic acid. Many patients with mitochondrial disease have lactic acidosis.

Inhibitors of ETC & DNA mutations cause increased NADH --> increased NADH/NAD+ ratio --> inhibition of PDH --> pyruvate cannot be converted to acetyl CoA --> conversion of pyruvate to lactate --> lactic acidosis

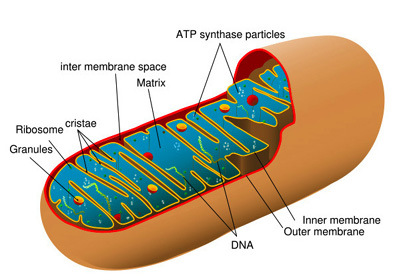
Mitochondrial DNA (mtDNA) encodes 13 subunits of ETC complexes
Nuclear DNA (nDNA) encodes >70 subunits of proteins in oxidative phosphorylation

Cori cycle


The Cori cycle involves the utilization of lactate which is produced by anaerobic glycolysis in non-hepatic tissues such as myocytes (muscle cells) and erythrocytes (red blood cells) as carbon source for hepatic gluconeogenesis. Liver then converts the lactate back into glucose for use by non-hepatic tissues. The gluconeogenic part of Cori cycle utilizes ATP (net consumer of energy, uses an extra 4 ATP) and the Cori cycle canot be sustained indefinitely.

Elimination of nitrogenous wastes

Why does the body make nitrogenous wastes? How does the body process nitrogenous wastes? The body processes nitrogenous wastes in 4 ways - 1) Glutamine, 2) Transamination, 3) Deamination, and 4) Urea. What is the role of glutamine in nitrogenous waste transport? Transamination is converting one amino acid to another. Deamination is removing the amine from an amino acid. Example of transamination and deamination is the glucose-alanine cycle. Urea synthesis occurs in the liver.

Cellular respiration

Cellular respiration is the process in which an organism breaks down fuel (glucose, glycogen, protein, lipids) to capture energy in a usable form (ATP).

Phosphorylation and dephosphorylation

When a phosphate (P) is passed from ATP to another molecule, that molecule gains enegry; this is an endergonic (energy storage) reaction. Likewise, when that phosphate is removed, both energy and heat are given off (an exergonic reaction), and the molecule contains less energy than before.


See diagrams here:

Summary
  1. Metabolism - all chemical reactions
  2. Anabolic reactions - synthesis; catabolic reactions - breakdown
  3. Phosphorylation - add P to a molecule to active/deactivate it; priming
  4. Processing of energy-containing nutrients - 3 stages: 1) Digestion, 2) Anabolism/catabolism, and 3) Oxidative breakdown
  5. Oxidation-Reduction (redox) reactions - 1) two reactions paired/always coupled, 2) electrons lost/gained, 3) involved coenzymes
  6. Coenzymes - nicotinamide adenine dinucleotide (NAD+) and flavin adenine dinucleotide (FAD)
  7. Mechanisms of ATP synthesis - 2 ways - 1) Substrate-level phosphorylation (SLP) - direct, and 2) Oxidative phosphorylation (OP) - Chemiosmotic processes - membrane & chemical reactions
  8. Carbohydrate metabolism - complete oxidation of glucose - 3 stages - 1) Glycolysis, 2) Citric acid cycle/Krebs cycle/TCA cycle, and 3) ETC/OP
  9. Complete oxidation of glucose: C6H12O6 + 6O2 --> 6H2O + 6CO2 + 36 ATP + heat
  10. Glycolysis - breakdown of glucose to pyruvate - 3 phases - 1) Sugar activation - uses ATP to make fructose 1,6-biP, 2) Sugar cleavage - fructose 1,6-biP --> glyceraldehyde 3-P & dihydroxyacetone P, 3) Oxidation & ATP formation - 3C sugars oxidized (NAD+ reduced) and Pi attaches to each oxidized fragment. Final products of glycolysis: 6H2O + 6CO2 + 36 ATP + heat
  11. Citric acid cycle/Krebs cycle/TCA cycle - fueled by pyruvic acid and free fatty acids (FFA)
  12. Formation of acetyl CoA - 3-step process - 1) Decarboxylation, 2) Oxidation - removal of H atoms from pyruvic acid, and 3) Formation of acetyl CoA
  13. Electron Transport Chain (ETC) - 1) Accepts H+, 2) Protein chain (cofactors), 3) Formation of oxygen, and 4) Release of energy - oxidative phosphorylation --> ATP
  14. Mechanism of Oxidative Phosphorylation - 1) H --> H+ + e-, 2) Proton pump --> proton motive force, 3) Electrons shuttled, 4) Formation of water, and 5) H+ diffuse --> ATP
PowerPoints

http://slideplayer.com/search/Energy+Metabolism/

http://slideplayer.com/slide/4352474/

Influenza A (H1N1) Pandemic

2009 Pandemic
The at risk groups:
  1. People with lung disease
  2. People with heart disease
  3. People with kidney disease
  4. People with diabetes
  5. Those with immunosuppression problems either because of treatment or disease
  6. Patients who have had drug treatment for asthma
  7. Pregnant women
  8. Children under five
More at: http://news.bbc.co.uk/2/hi/health/8021958.stm